p3-insta485-clientside
React/JS Debugging Tutorial
This tutorial will walk you through how to debug Javascript with browser tools and debug React code with React Dev Tools.
Finish React Setup
To follow along with this tutorial, make sure you have finished the React setup first as described in the React/JS section.
JavaScript Debugger
The following tutorials discuss how to use browser tools to debug plain JavaScript without having to add console.log() statements everywhere. Be sure to read the tutorial for your preferred browser, as this will help you understand the React Dev Tools much better. We recommend Chrome (or similar like Brave or Chromium) or Firefox because they also support the newer React Dev Tools Extension.
Chrome
Get Started with Debugging JavaScript in Chrome DevTools
Firefox
Safari
Remember that static pages and server-side dynamic pages tools still apply!
React Debugger
Debugging React code can be tricky if you try to apply the JavaScript debugging tools on the JavaScript code that was transpiled from your React code. Instead, we can use the React Dev Tools browser extension, which allows you to view your React components as HTML DOM elements in the Developer Tools and see the props and state for each component. In the following section, we will walk through how to debug code for the Post widget you created in the React setup.
First, add React Developer Tools to Chrome or Firefox.
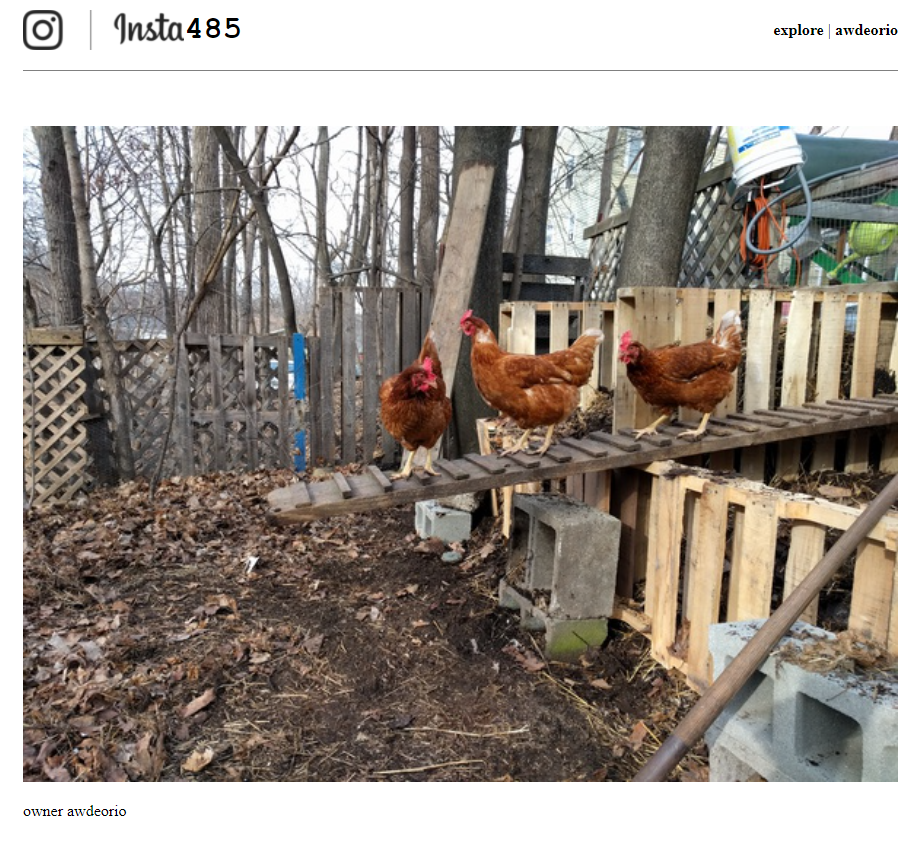
Verify that you’ve done the setup tutorial correctly. Build, run and navigate to http://localhost:8000/, where you should see your post widget with the text “awdeorio” after logging in.
$ pwd
/Users/awdeorio/src/eecs485/p3-insta485-clientside
$ npx webpack
...
$ ./bin/insta485run
...
For the purpose of this tutorial, let’s say there is a bug somewhere in your React code that is causing “owner awdeorio” to be displayed instead of just “awdeorio”.
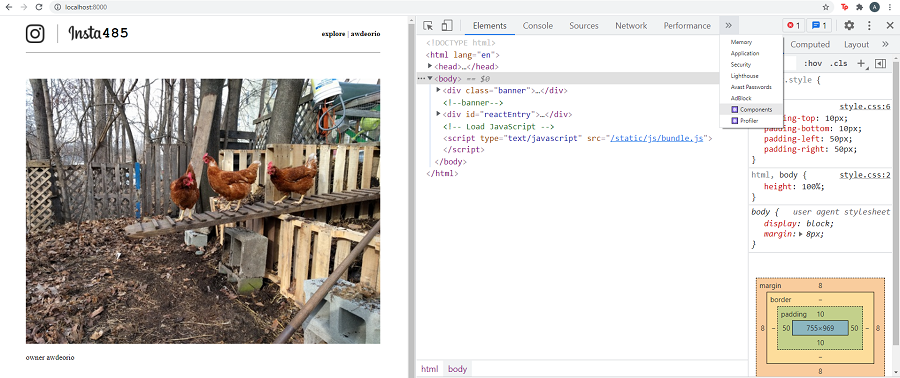
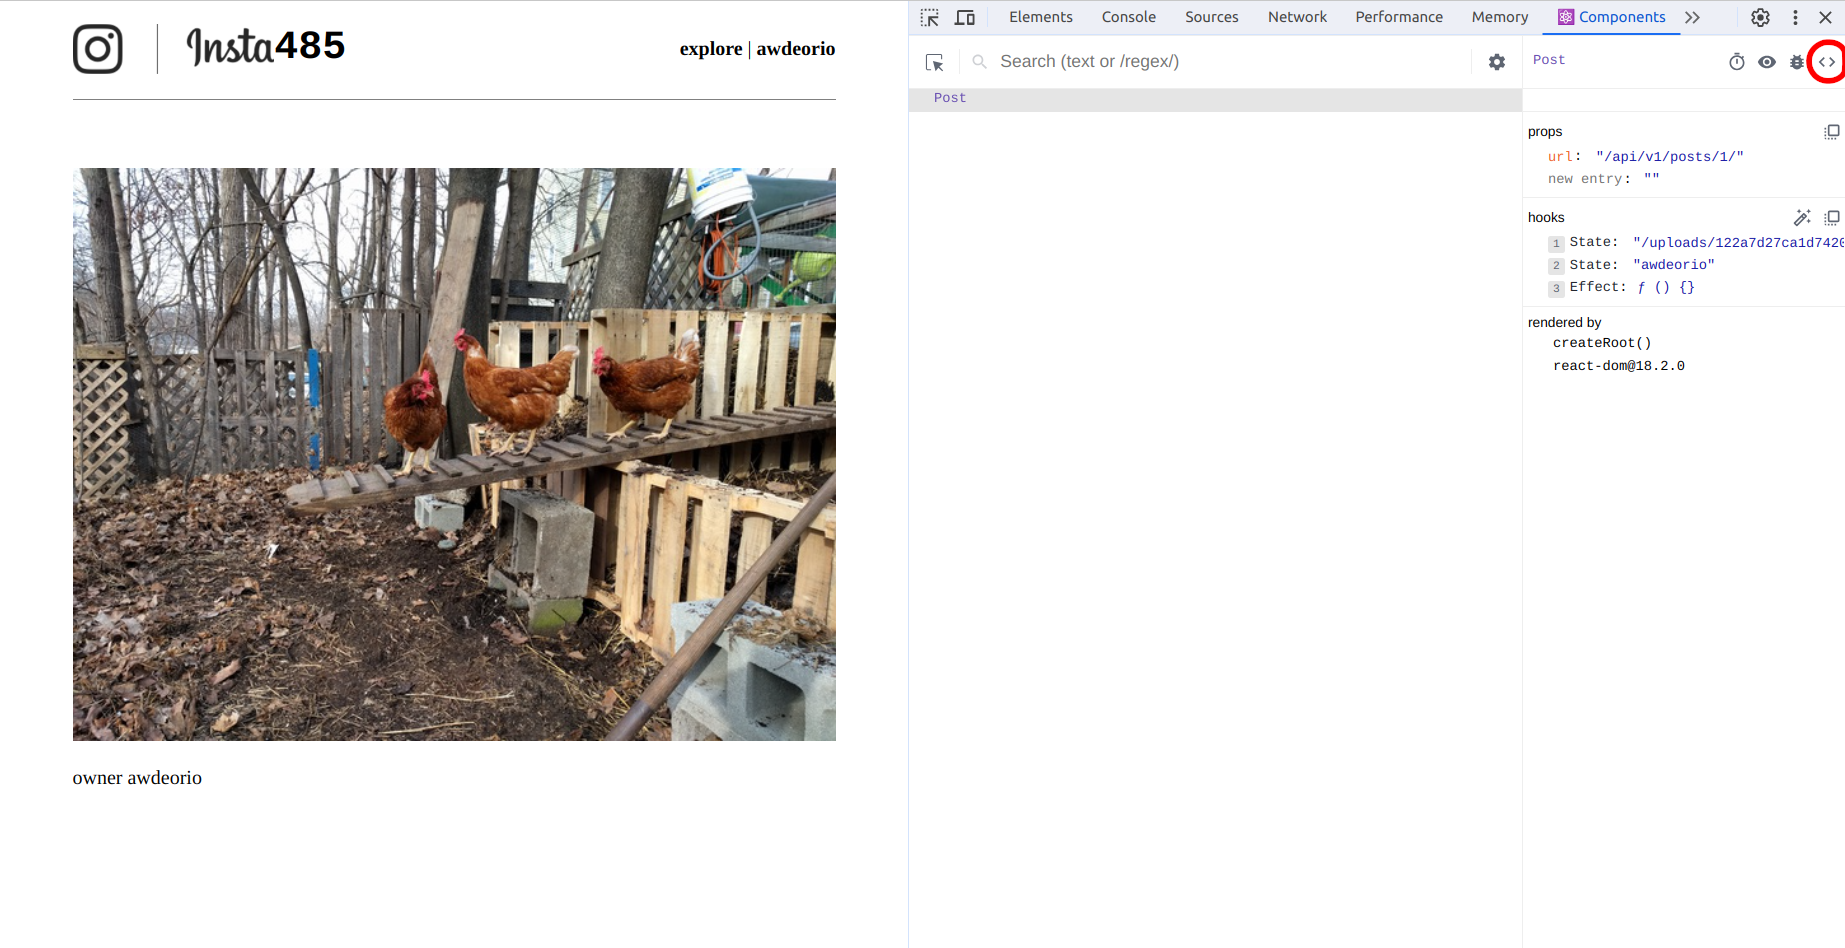
Open up the browser’s developer tools, click on the arrow to see more tabs, and click on the Components tab, and click on the Post component. You should see the Post component with its props and hooks. You can also inspect the matching DOM element by clicking on the eye icon. As you can see, the state of owner is awdeorio as expected, so most likely the bug is introduced when the component is being rendered.

To view the source code associated with a particular component, click on the “View source for this element” button in the top right corner (looks like < >). You should now see the React code associated with the Post component in a relatively readable format unlike your bundle.js.
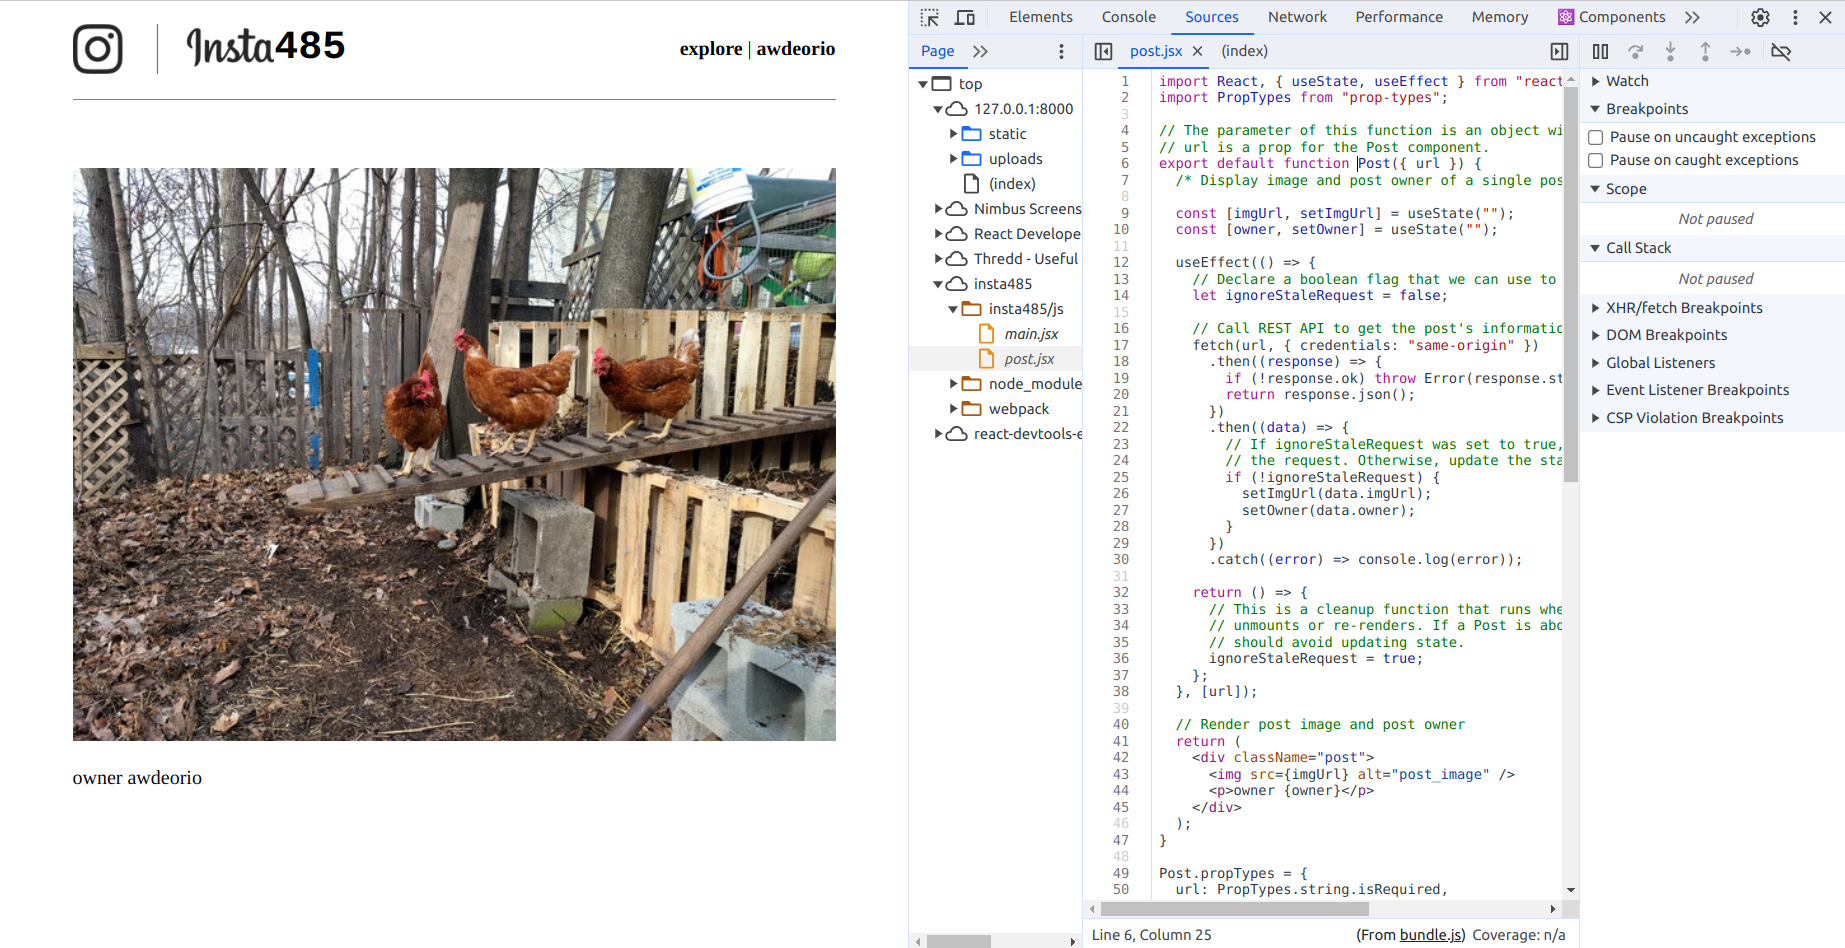
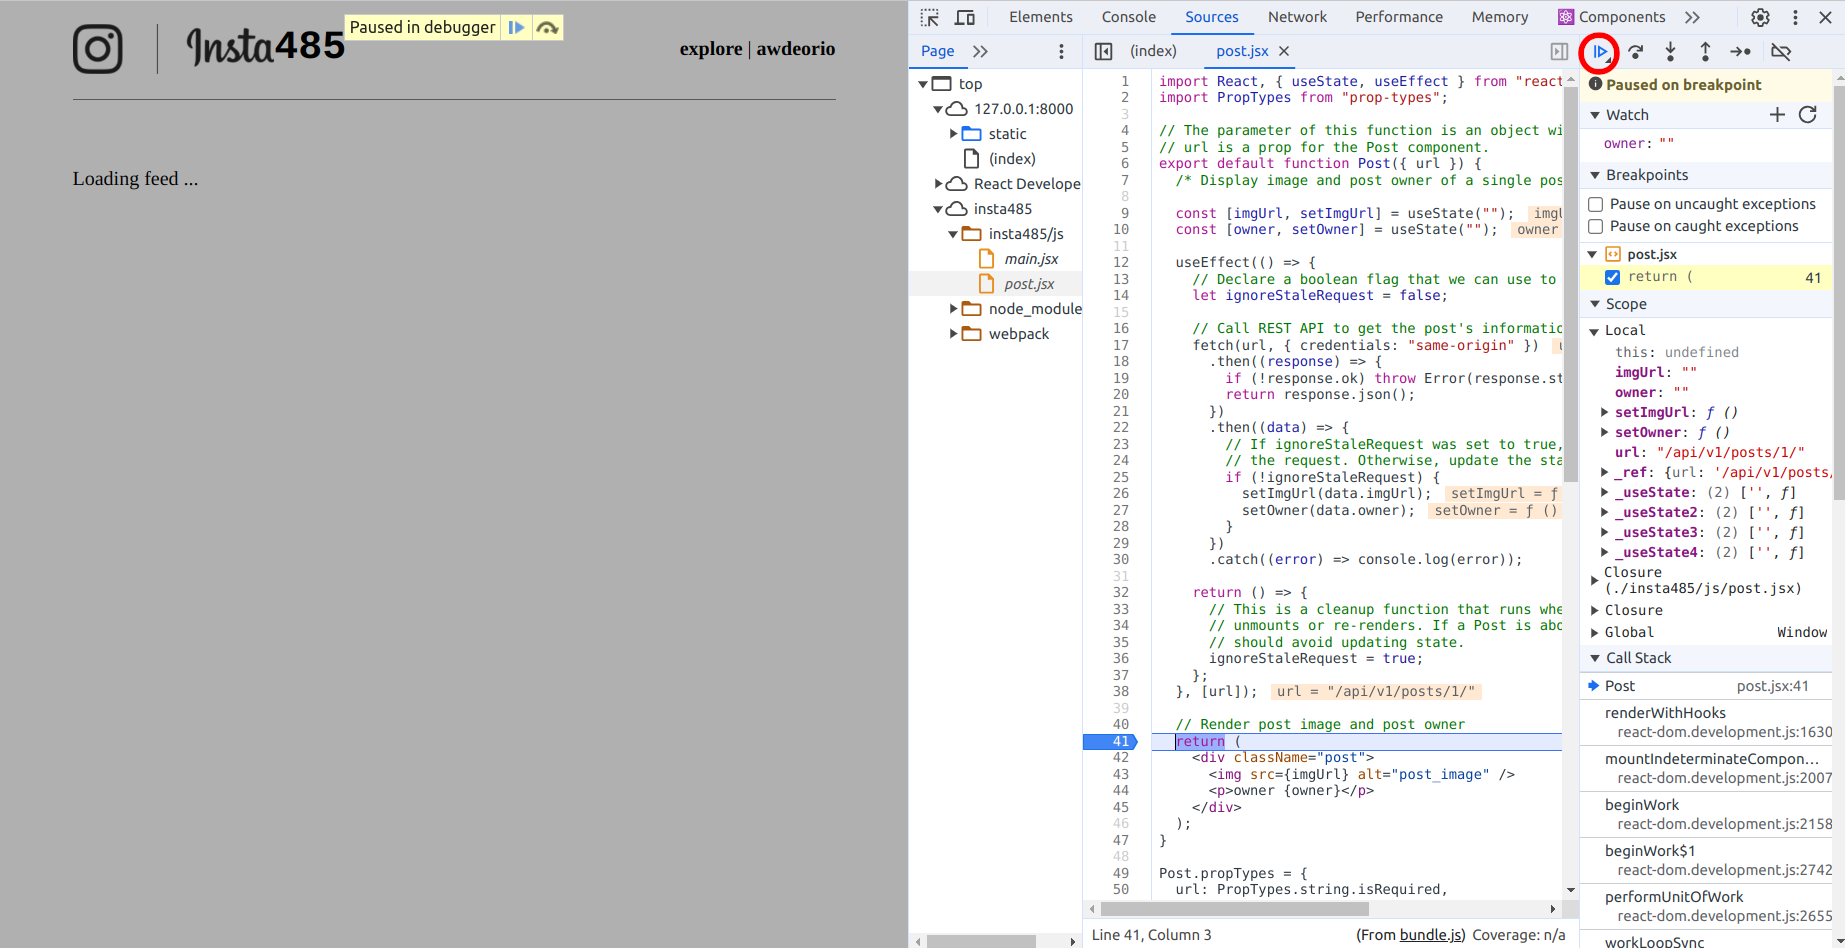
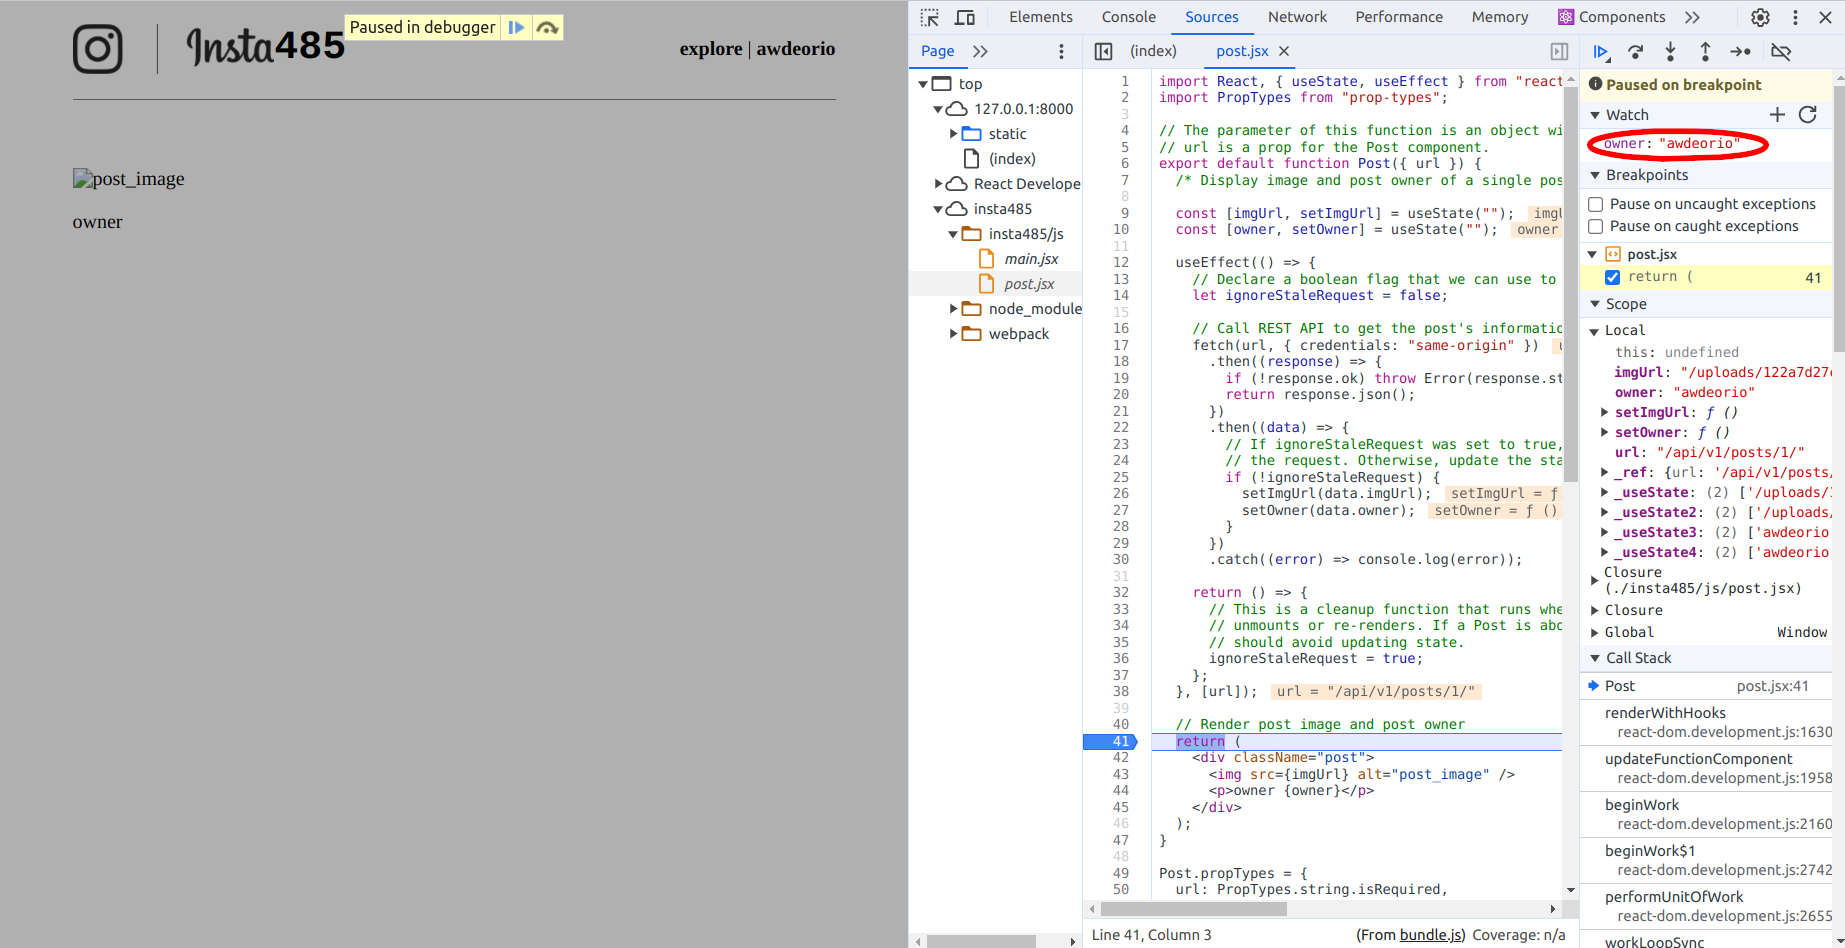
Since we think the bug is being introduced when the component is rendered, let’s set a breakpoint at the return statement, and add the variable of interest (owner) to the watch section, and refresh the page. You should see that the page is not fully loaded and the execution stopped on your breakpoint. Note that owner is empty because the component has not yet mounted. So click on the “Resume script execution” button a few more times until useEffect has completed. Now notice that owner is awdeorio.
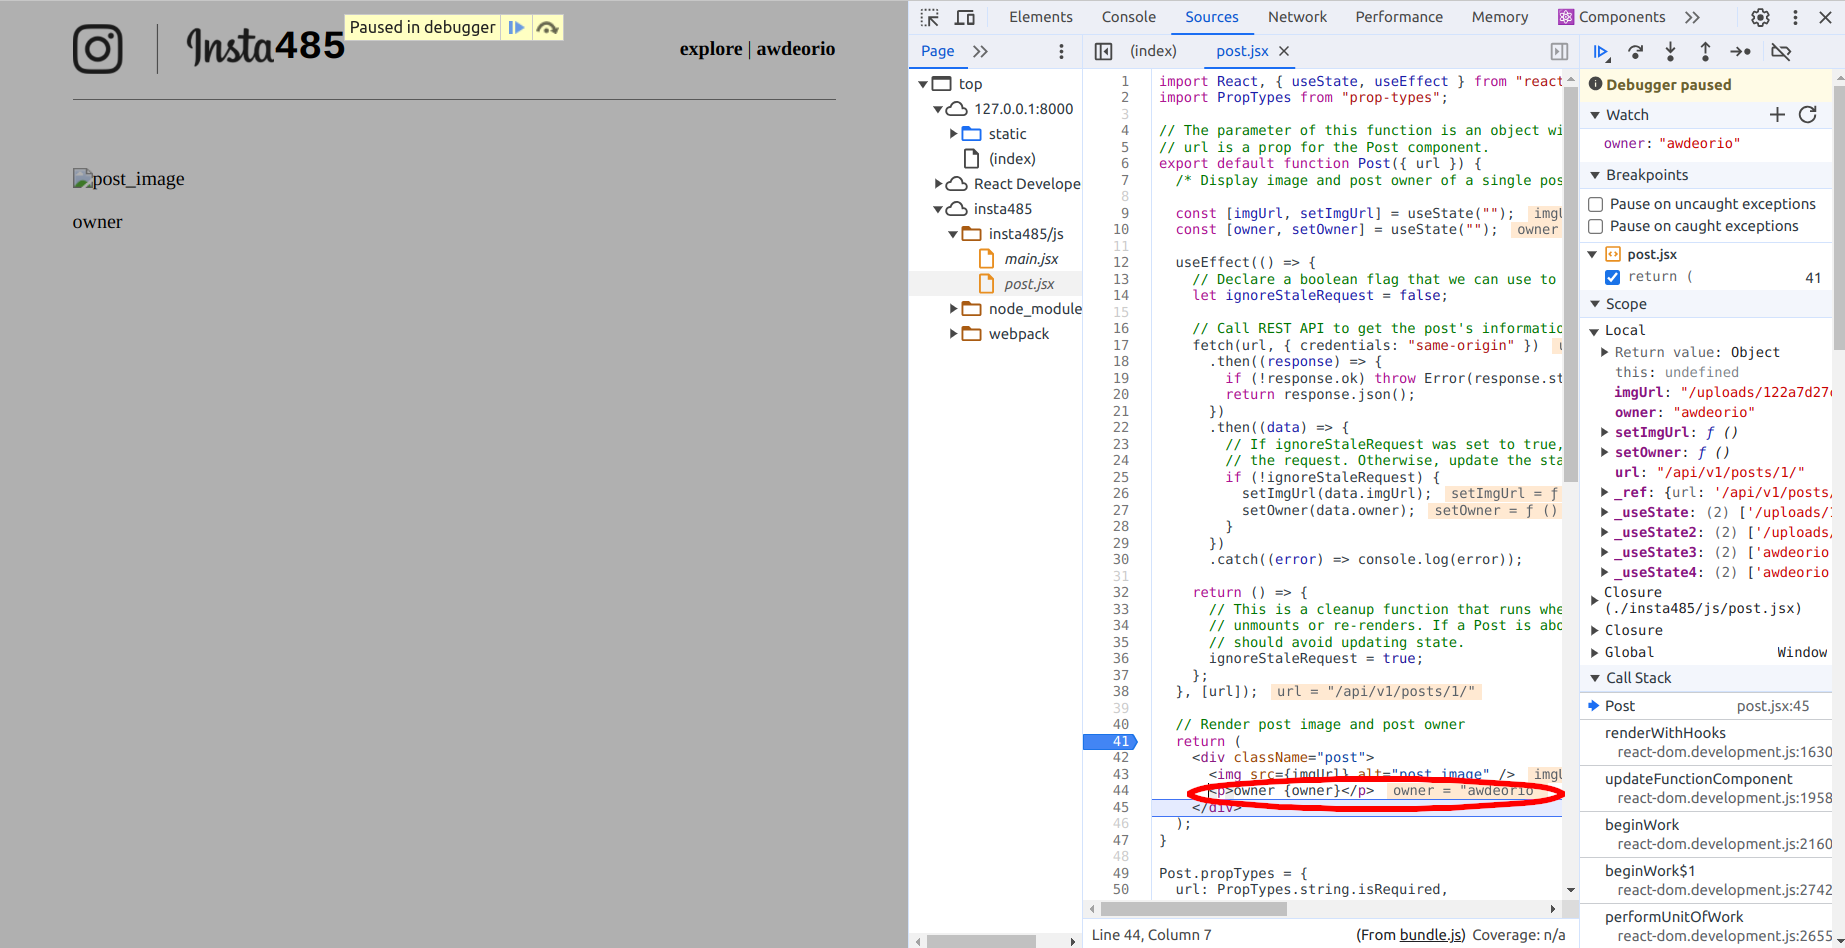
Since we are using the local variable owner to display the owner of the post, the bug most likely involves owner. As you step through the lines of code, you should notice that you are rendering the string "owner " and the variable owner instead of just the variable owner. This is why owner appeared on the screen before the state was updated with awdeorio. You have now caught your bug!
Debugging React code is not as simple as debugging single-threaded C++ programs in an IDE because of the asynchronous nature of JavaScript. Make sure you understand what part of the execution you are in (at the top level of the function, in a useEffect, in a custom hook, etc.) as that will help you diagnose the root cause of bugs much faster.
End-to-end testing
You should also read the end-to-end testing tutorial. The tools mentioned in this tutorial are great for detail-oriented debugging, but we rely on end-to-end testing in order to make sure that the end user experiences all of the correct behavior. Some people find it helpful to have Cypress constantly open and running tests, allowing you to use your browser’s dev tools during a test at different points in time. Another option is to use your browser’s dev tools normally while working on a feature, checking that your React components are transferring state in expected ways, and then run end-to-end tests after you’re finished with the feature. Just note that the React Developer Tools browser extension may be tricky to use with Cypress, so you may want to use that only in a normal browser window.
Acknowledgments
Original document written by Andrew DeOrio awdeorio@umich.edu.
This document is licensed under a Creative Commons Attribution-NonCommercial 4.0 License. You’re free to copy and share this document, but not to sell it. You may not share source code provided with this document.