p1-insta485-static
Browser Developer Tools Tutorial
This tutorial will explain how to use the developer tools built in to your web browser.
Table of Contents
- Browser Developer Tools Tutorial
- View source
- Hard refresh
- Developer tools
- Console
- Elements AKA DOM
- Cookies
- Private browsing
- JavaScript debugger
View source
View the HTML source of a web page.
Chrome
- Windows/Linux
Control+U - MacOS
Command+Option+U - “View” > “Developer” > “View Source”
Firefox
- Windows/Linux
Control+U - MacOS
Command+Option+U - “Tools” > “Web Developer” > “Page Source”
Safari
- MacOS
Command+Option+U - “Tools” > “Web Developer” > “Page Source”
Hard refresh
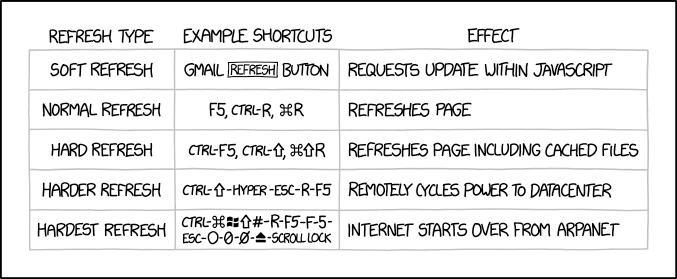
Portions of a page such as images and JavaScript source code are sometimes cached by the browser. If you change the source code or image, you need to tell your browser to reload it. This comic explains (credit: xkcd.com).
Developer tools
How to open the developer tools.
Chrome
- Windows/Linux
Control+Shift+I - MacOS
Command+Option+I - “View” > “Developer” > “Developer Tools”
Firefox
- Windows/Linux
Control+Shift+K - MacOS
Command+Option+K - “Tools” > “Web Developer” > “Web Console”
Safari
- MacOS
Command+Option+I - “Develop” > “Show Web Inspector”
- First time: “Safari Menu” > “Preferences” > “Advanced” “Show Develop menu in menu bar”
Console
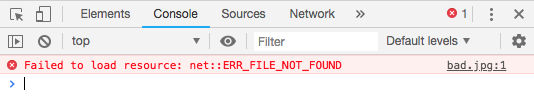
Use the console to see errors generated while rendering a page. Also, anything sent to console.log() in JavaScript will appear in the console.
For example, create test.html with the following contents.
<html>
  <body>
    Hello world!
    <img src="bad.jpg" />
  </body>
</html>
Open test.html in your browser. Open the developer tools. Select the Console tab.
Elements AKA DOM
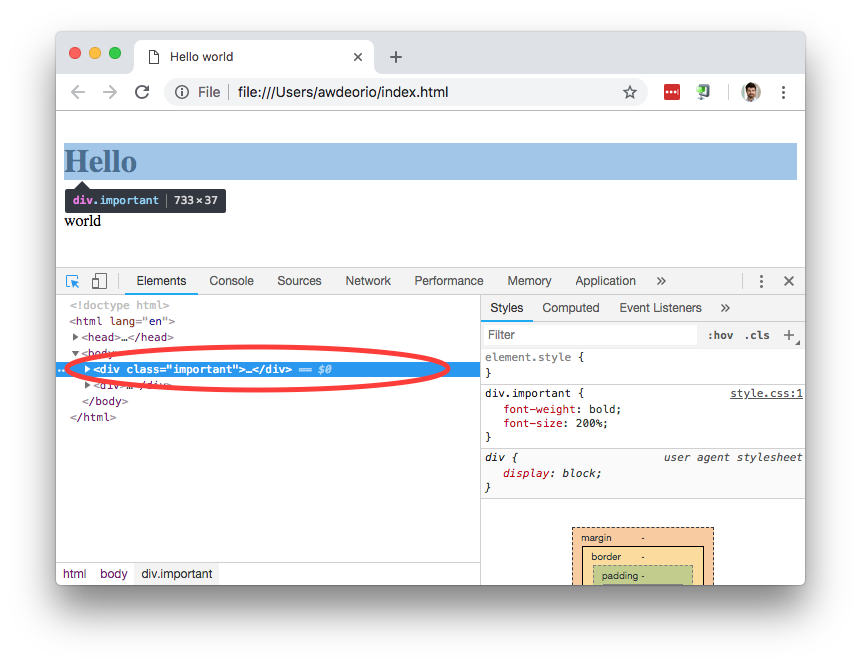
Use the Elements tab to link rendered parts of a page to the underlying HTML and CSS. This is the Document Object Model (DOM).
Create two files for this example, index.html and style.css.
<!DOCTYPE html>
<html lang="en">
  <head>
    <title>Hello world</title>
    <link rel="stylesheet" type="text/css" href="style.css" />
  </head>
  <body>
    <div class="important"><p>Hello</p></div>
    <div><p>world</p></div>
  </body>
</html>
div.important {
  font-weight: bold;
  font-size: 200%;
}
Open index.html in your browser. Open the developer tools. Select the Elements tab.
Click a line of HTML to see where it appears on the rendered page.
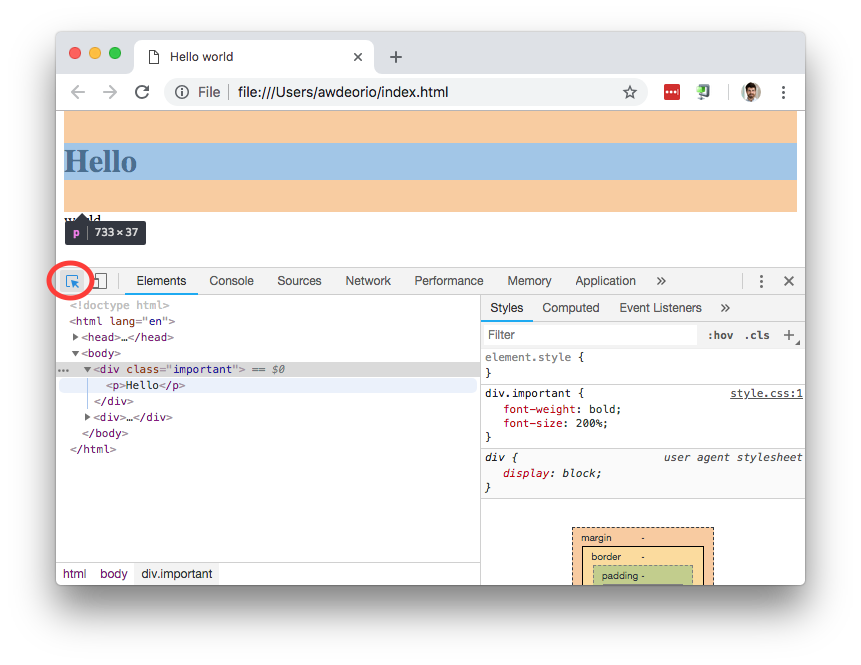
Use the selection tool to hover over a rendered part of the page and see the HTML behind it.
Cookies
To inspect cookies, you’ll need to open the developer tools for your browser first.
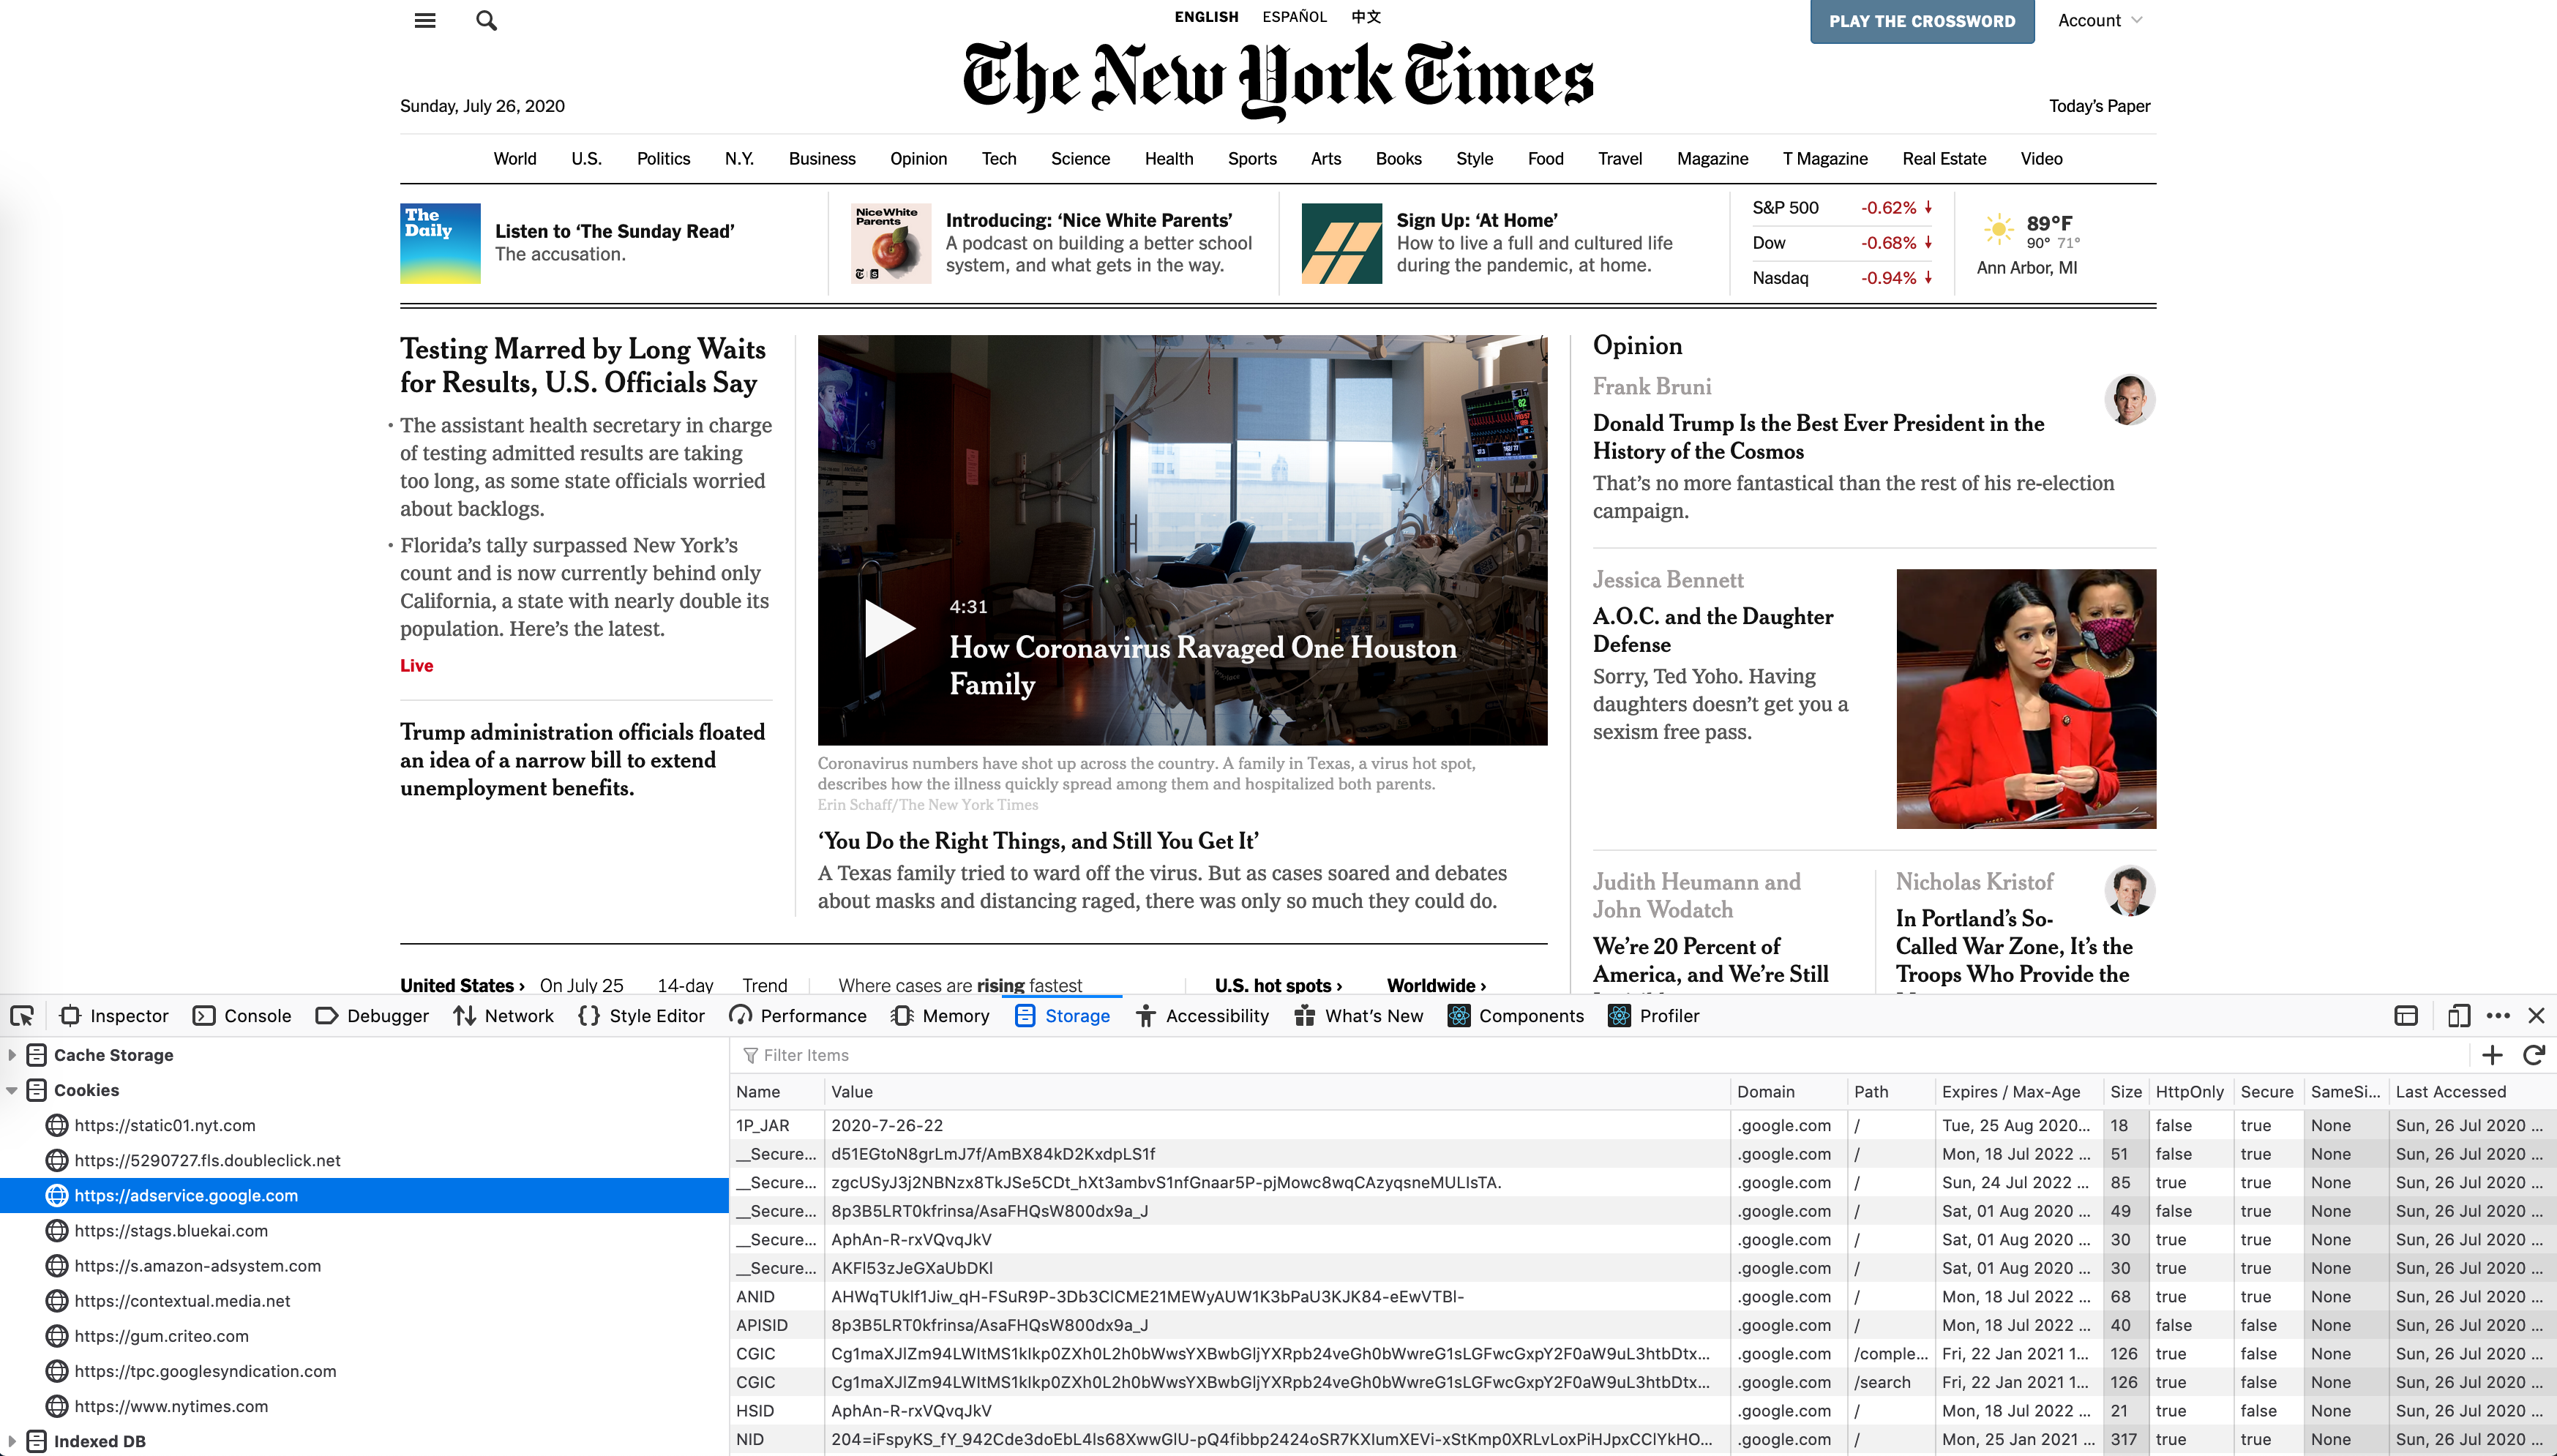
Open up a new tab and navigate to any news website (example here is the NY Times). Inspect the cookies. You can see attributes such as the name, value, domain, expiration date, and more about each cookie. Cookies whose domain matches the current page are first-party cookies, and those with a different domain are third-party cookies.
Chrome
- Windows/Linux
Control+Shift+C–>Application–>Cookies - MacOS
Command+Shift+C–>Application–>Cookies - Any OS - “View” > “Developer” > “Developer Tools” > “Application” > “Cookies”
Firefox
- Windows/Linux
Control+Shift+C–>Storage–>Cookies - MacOS
Command+Shift+C–>Storage–>Cookies - Any OS - -“Tools” > “Web Developer” > “Toggle Tools” > “Storage” > “Cookies”
Safari
- MacOS
Option+Command+I–>Storage–>Cookies - Any OS - “Develop” > “Show Web Inspector” –> “Storage” –> “Cookies
- First time: “Safari Menu” > “Preferences” > “Advanced” “Show Develop menu in menu bar”
Private browsing
Private browsing mode creates a temporary session with separate cookies, browser history, etc. When you close all your private browsing tabs, the temporary information is removed.
Chrome “Incognito Window”
- Windows/Linux
Control+Shift+N - MacOS
Command+Shift+N - Any OS - “File” > “New Incognito Window”
Firefox “Private Window”
- Windows/Linux
Control+Shift+P - MacOS
Command+Shift+P - Any OS - “File” > “New Private Window”
Safari “Private Window”
- Windows/Linux
Control+Shift+N - MacOS
Command+Shift+N - Any OS - “File” > “New Private Window”
JavaScript debugger
Project 3 JavaScript Debugging Tutorial
See the Project 3 React/JS Debugging Tutorial for tools for debugging Javascript with browser tools.
Acknowledgments
Original document written by Andrew DeOrio awdeorio@umich.edu.
This document is licensed under a Creative Commons Attribution-NonCommercial 4.0 License. You’re free to copy and share this document, but not to sell it. You may not share source code provided with this document.